Codester demo · Business software
DataDeck — Business Dashboards
A dashboard program you run on your own server: connect a CSV, a Google Sheet, or a database, and read revenue, spend, and traffic as charts instead of raw exports.
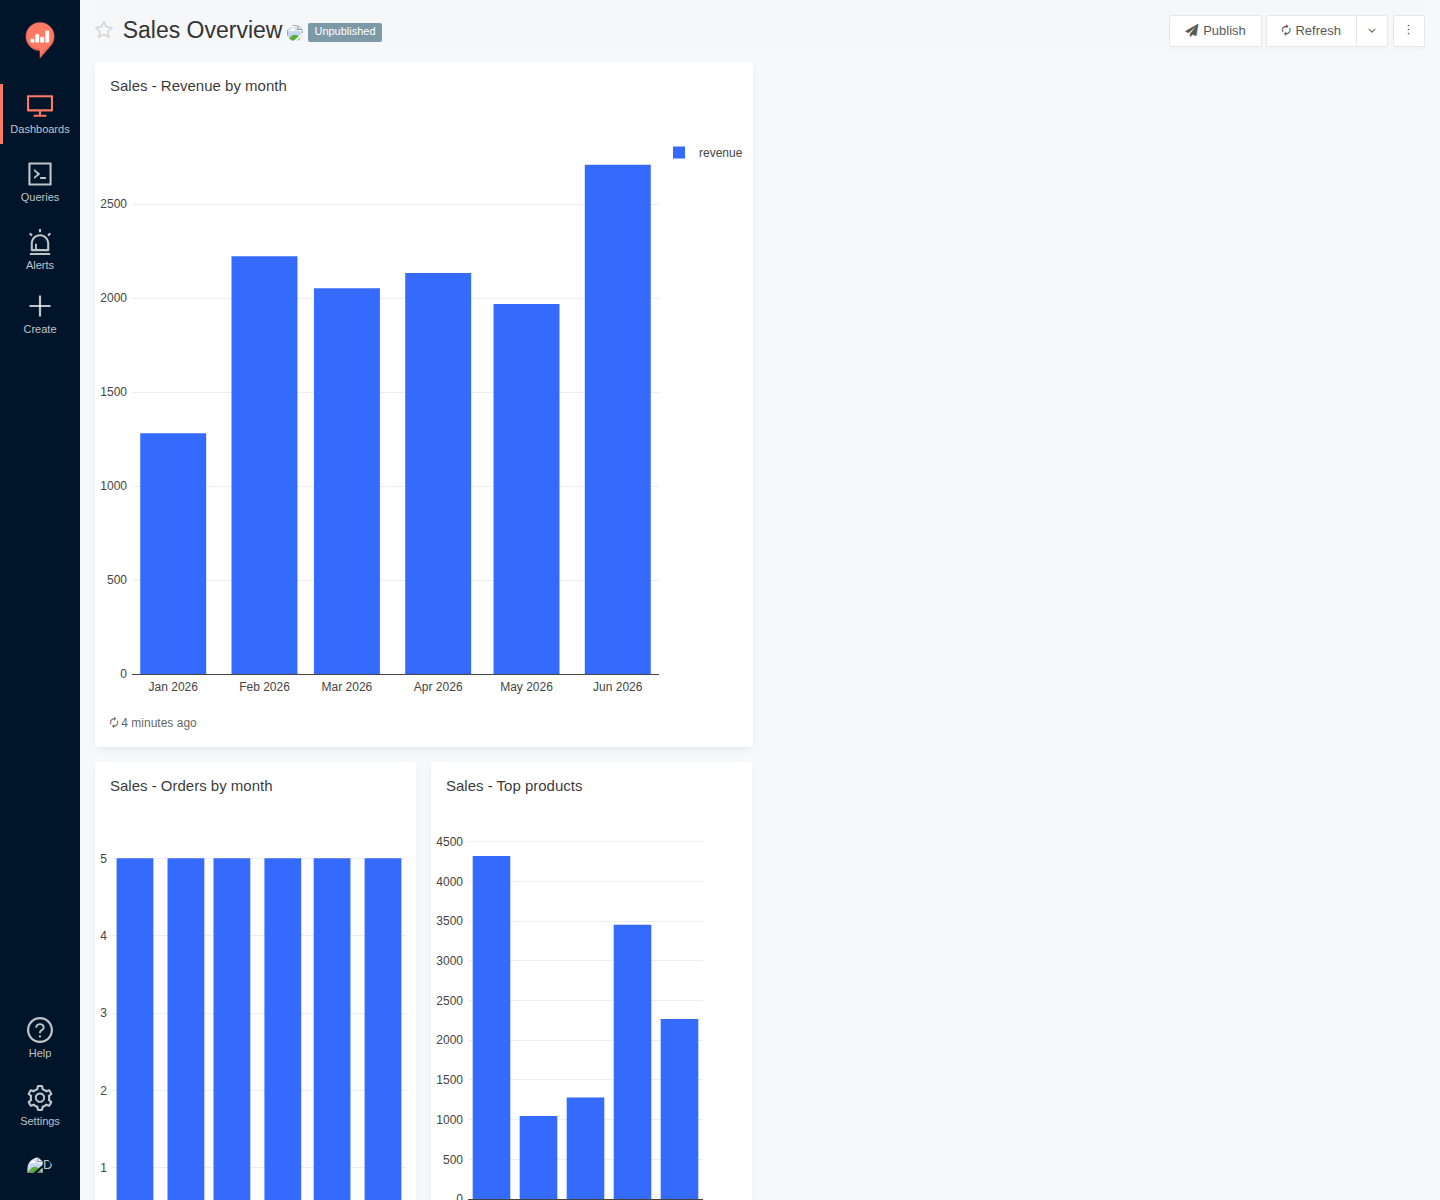
The Sales Overview, built from the starter pack
During packaging, the whole stack was booted and the Sales Overview starter dashboard was actually built in it — on the fictional sample sales file that ships in the package (January–June). Revenue by month up top, orders and top products below. The buyer builds the same dashboard by following the printed guide.
One chart, full page
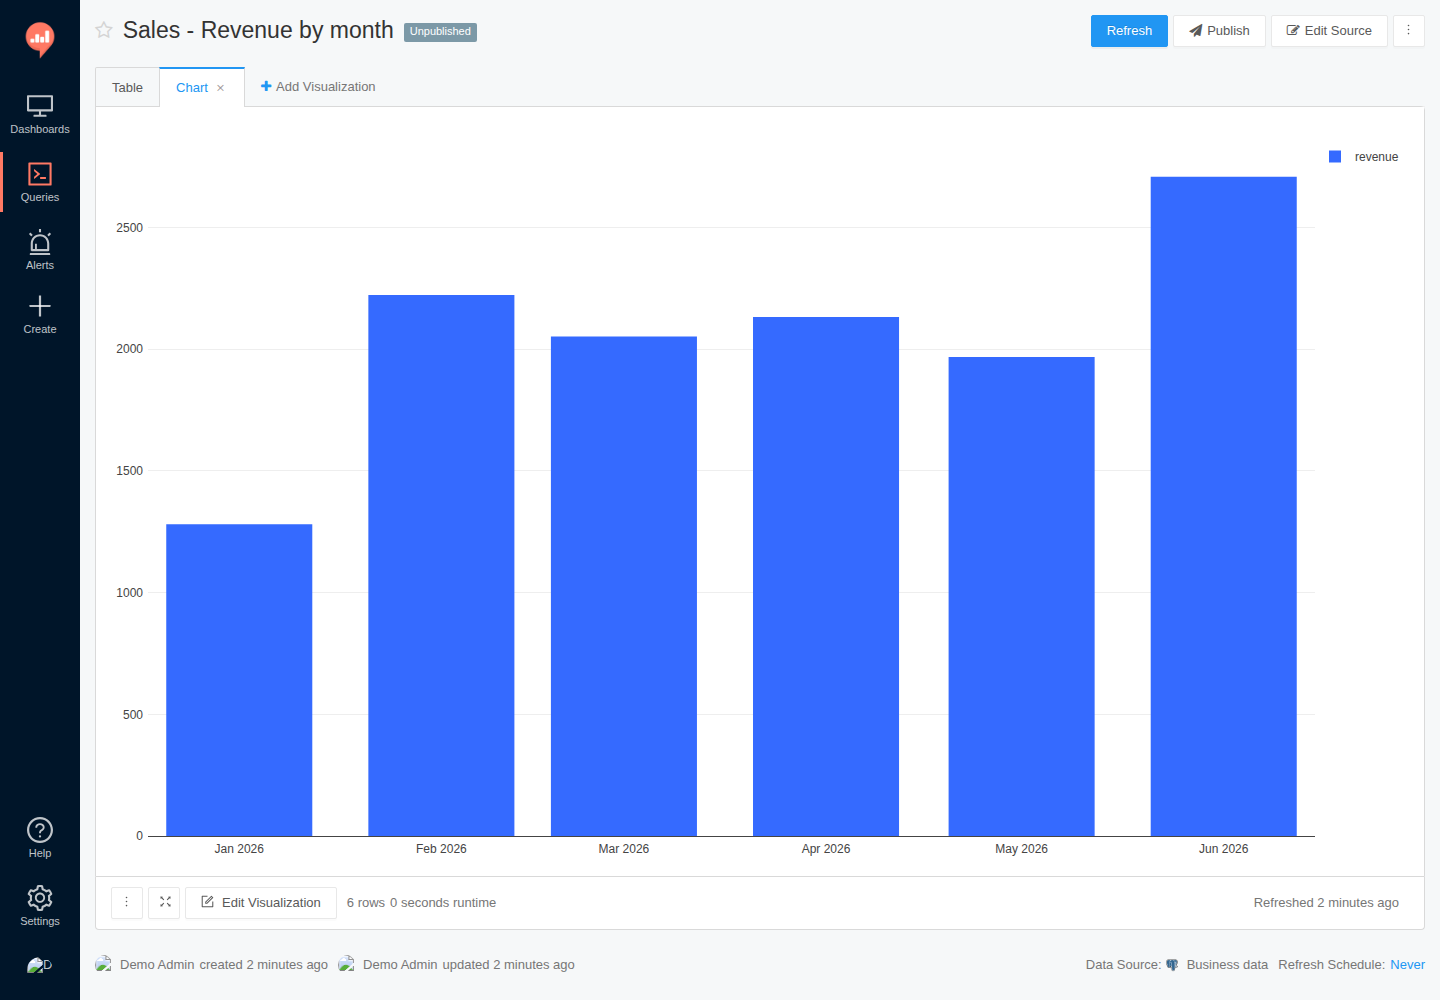
The Revenue by month query with its chart: 1281 in January rising to 2709 in June — the same totals the starter guide prints, so a buyer can check their own build number for number.
First run
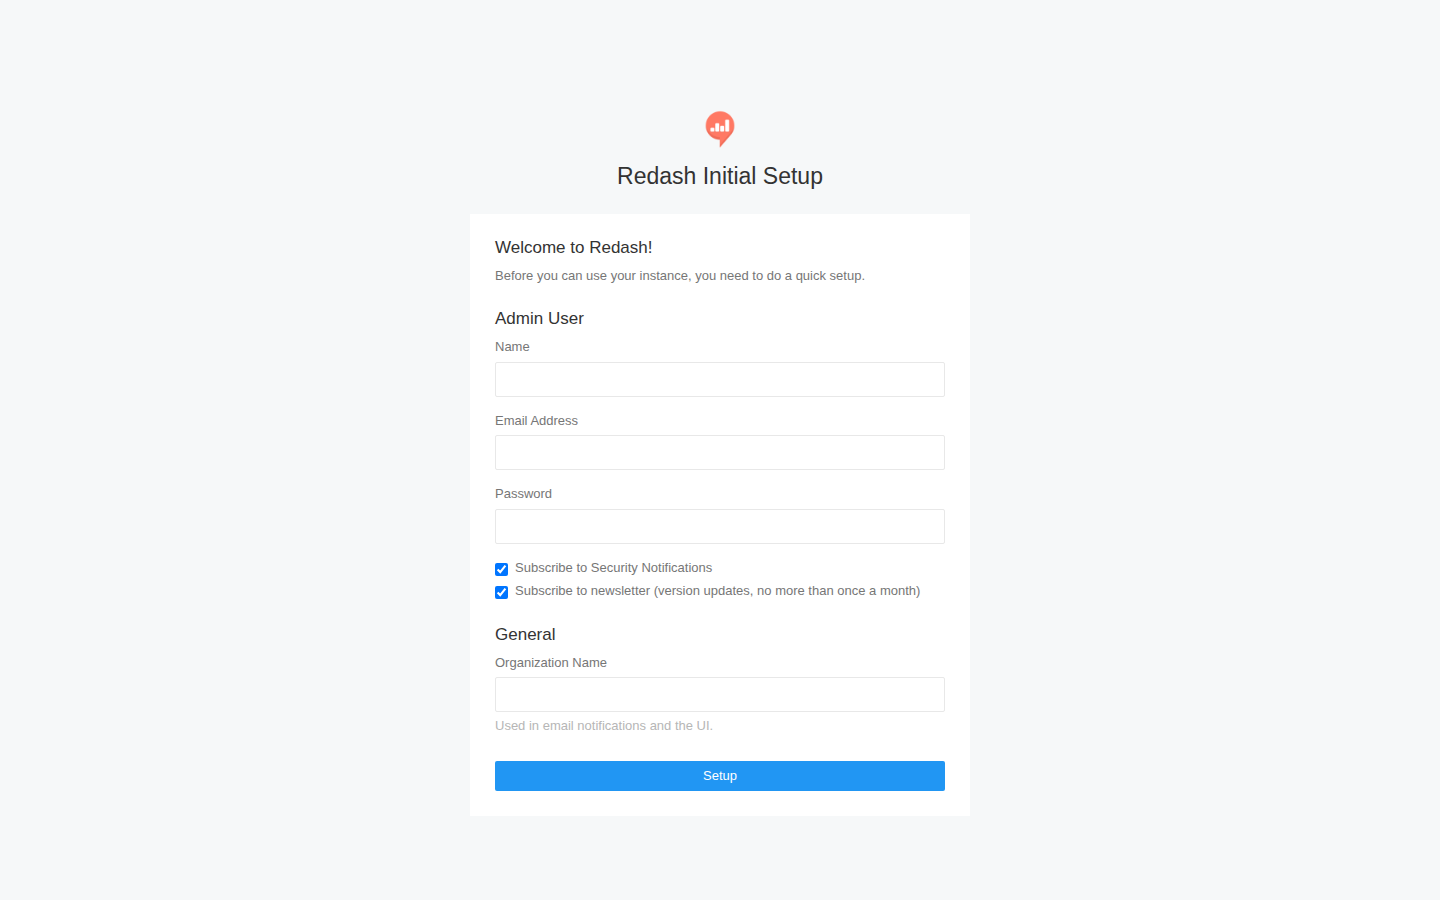
The first screen creates the admin account. Everything after that — connecting data, writing the first query, pinning the first chart — is walked through in the starter guides.
Booted and queried during packaging
Real lines from the packaging boot test: the setup step completed (exit 0), the web app answered and sent the browser to the login page, the admin signed in (200), and the starter-pack queries were executed by the app's own worker against the sample data.
=== DataDeck boot test — Thu Nov 12 16:28:37 UTC 2026 ===
=== create_db (the install script's setup step) ===
create_db exit: 0
302 -> http://localhost:5000/login?next=http://localhost:5000/
=== Route A validation: create business DB, load all 3 sample CSVs ===
=== queries-postgres.sql: Sales Overview ===
=== queries-postgres.sql: Website KPIs ===
=== queries-postgres.sql: Expense Tracker ===
=== All five services during the test ===
=== Worker log (query jobs run by the worker service) ===
=== API build of the Sales Overview dashboard (via the app API) ===
login 200; data source 'Business data' (Postgres -> business DB) created id=1
What it does
- Connect the data you already have: Postgres or MySQL databases, a CSV file at a web address, or a Google Sheet — plus a long list of other sources built in
- Write a short query, get a chart: bar, line, area, pie, counter, pivot table, and more, explained in plain words in the user guide
- Three starter dashboards included with build guides and sample files: Sales Overview, Website KPIs, Expense Tracker — each guide prints the sample file's real totals so you can check your build
- Query library included: last-30-days totals, month-over-month change, top 10, running totals, and rolling averages, in both Postgres and CSV/Sheets dialect with the differences flagged
- Dashboards you can share with a read-only link, queries that refresh on a schedule, and alerts when a number crosses a line you set
- Runs on your own machine with Docker — five services, pinned versions, one-command install; your data stays on your server, no subscription